(Bloomberg Intelligence) — The 10-year Treasury yield may approach but not breach 2%, as our end-2022 scenario sees a rate just above 1.9%. We look for near-term curve steepening, then flattening in 2022 as the front end prices for 2023 rate hikes.
The 10-year Treasury yield could linger below 2% until the Federal Reserve begins to increase the federal-funds rate. As taper approaches and the market re-prices for a new supply/demand dynamic and continued, albeit uneven economic growth, we think Treasury yields will retest this year’s high over the course of 4Q. The front end, however, should remain relatively pegged, suggesting the 2-year/10-year curve should steepen into year-end. In 2022, however, we see the yield curve flattening.
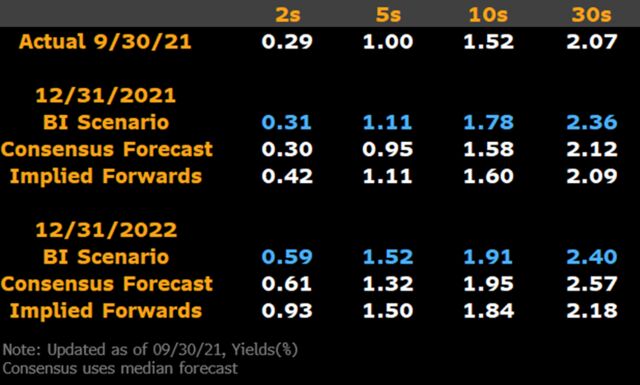
Our initial read on end-2022 yields suggests some modest curve flattening, with the 10-year reaching old resistance levels just under 2%, with the 5-year underperforming along the curve. This view is predicated on a 2023 Fed liftoff, as we noted in our outlook of Sept. 29 (see link right).
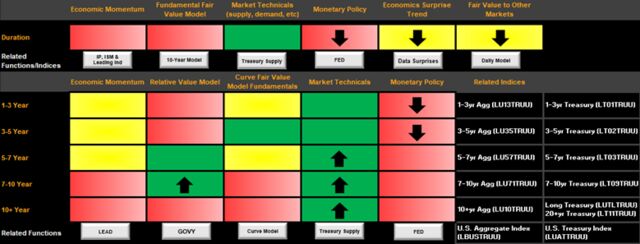
There have been several shifts over the course of the month for our tactical duration and curve scorecards. In particular, with the Federal Reserve clearly on the path to taper asset purchases, and economic momentum looking as if it may be stabilizing rather than falling, the duration scorecard suggests yields may rise somewhat further, leading to near-term negative returns of the Bloomberg Treasury Index.
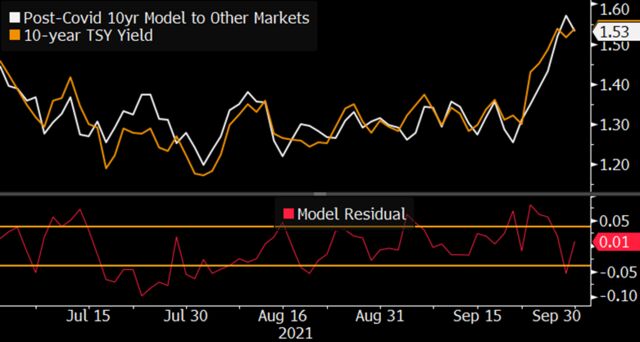
Along the curve, the Fed’s taper, coupled with cuts to Treasury coupon issuance means risk added to the market may remain stable (see link right). Otherwise, the yield curve scorecard suggests a very modest steepening bias, but the Bloomberg exponential spline model now suggests the 10-year is a bit cheap after being near fair value for several months (use GOVY function to view).
Yields on 10-year Treasuries are about 20 bps lower than our post-Global Financial Crisis model calculates. Using 1-year forward consensus economic forecasts, the model projects the yield could be about 1.7% at end-2022, with the 95% confidence range of 1.4-2%.
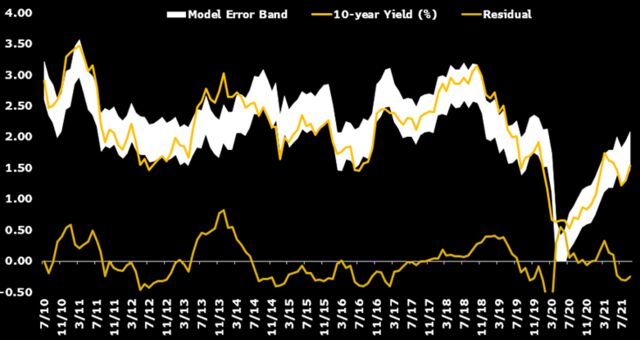
Methodology: The model uses OLS regression with monthly data inputs from July 2010 to the present. The five variables include 1-year forward consensus forecasts for GDP, CPI and the federal-funds rate. Also included are Federal Reserve assets as a share of GDP, and the 1-year/3-year Treasury curve as a term-premium proxy. Click on the data tab for an Excel output of both the long-term and post-Global Financial Crisis 10-year models.
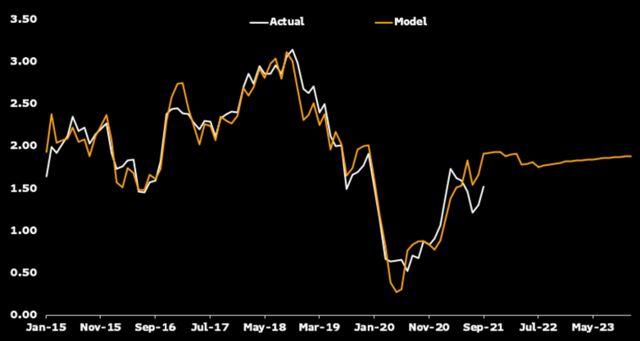
Our long-term 10-year model implies fair value of 1.91%. The model output, however, which uses consensus growth and inflation expectations as inputs, doesn’t calculate yields breaching 2% through the forecast horizon. Looking to the end of 2022 and 2023, the model calculates yields of 1.83% and 1.89%, respectively.
The model uses ordinary least squares regression with monthly data inputs. The five variables included are GDP growth, year-over-year CPI, Federal Reserve assets as a share of GDP, the fed-funds target rate, and the 1-year/3-year curve for Fed bias. We adjust the intercept lower by 38 bps to account for a post-Global Financial Crisis structural break.