(Bloomberg Economics) —
A roaring U.S. recovery, the highest inflation since 2008 and a historical low for real yields make strange companions. Bloomberg Economics’ analysis suggests that it’s a combination of Federal Reserve asset purchases and continued uncertainty about the outlook that’s depressing U.S. yields, opening the possibility of a marked increase in the months ahead as the Fed begins its taper and delta variant concerns ease.
- We estimate a time-varying parameter Bayesian VAR model including PCE inflation, GDP, asset purchase announcements, long-term bond yields and equity prices.
- The results suggest that quantitative easing and uncertainty on the outlook are offsetting the boost from the recovery, keeping real bond yields depressed.
- If those factors were removed, our model suggests U.S. 10-year yields could rise to 1.8% from 1.3%. A 50-basis-point increase in yields driven by stronger macro conditions would not derail the recovery.
For Bloomberg Intelligence analysis on U.S. rates click here. For more from Bloomberg Economics on the U.S. outlook click here.
Fed, Uncertainty Dragging Down Bond Yields
Quantitative easing works by depressing long-term yields. As yields fall, easier financial conditions, a shift of investments into risk assets, and a weaker dollar all boost activity in the real economy. At present, Bloomberg Economics’ analysis suggests QE may be working almost too well — contributing to historically low real yields.
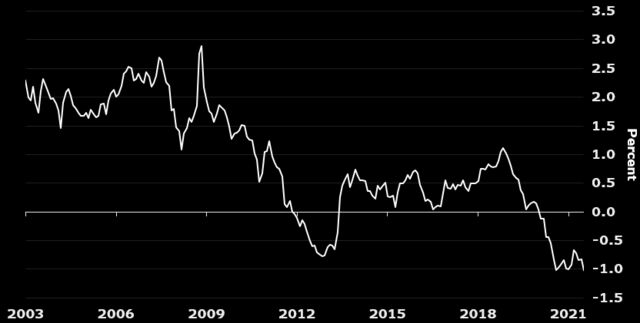
The yields on 10-year U.S. Treasuries is currently at around 1.3%, down from 1.5% in January 2020. That’s despite GDP growth of 6.5% in the second quarter and a CPI running above 5%. This development has brought down real yields to historical lows of about -1% in August.
Real Yields at Historical Lows
To explain why yields are so low despite strong growth and high inflation, we estimate a structural Bayesian VAR model:
- We estimate the model at a monthly frequency, including PCE inflation, our nowcast of monthly GDP, asset purchase announcements, long-term bond yields and equity prices.
- Taking account of the fact that the effects of QE may have weakened over time as markets have adapted expectations, we estimate the model with time-varying parameters.
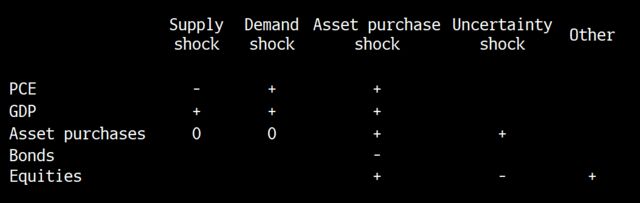
- To identify drivers of yields in our VAR, we use sign restrictions. For example, a positive demand shock pushes up GDP, inflation, equities and yields. Further details of the sign restrictions are in the methodology below.
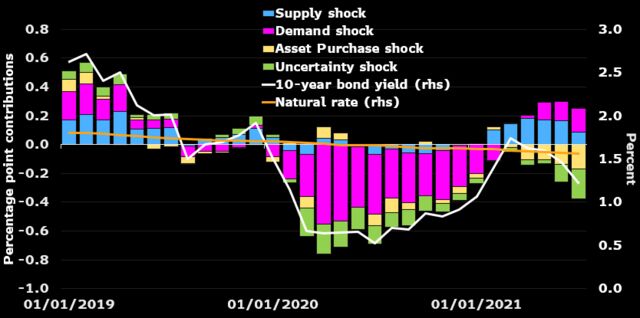
The results show that economic conditions — including robust demand and limited supply — are adding upward pressure to yields. But that is being more than offset by a combination of a lower natural rate of interest, the Fed’s asset purchases and uncertainty about the outlook.
An important takeaway from our analysis: the combination of the looming Fed taper and — hopefully — end of pandemic-era uncertainty could well prove a game-changer. As a crude extrapolation of our results, if asset purchases and uncertainty were not a factor, the model suggests yields would be 1.8%.
Methodology
Our approach builds on a paper by Wheale and Wieladek (2016). In particular, we use a structural Time-Varying Parameter Bayesian VAR model integrating five monthly time series. The VAR includes two lags, which has become standard in TVP-VAR models (Lubik and Matthes 2015). It is estimated with Bayesian methods, given the relatively high number of variables and short sample sizes.
We amend the model slightly, by assuming time-varying parameters and stochastic volatility. We also choose a slightly different set of variables: (1) for inflation, we use the log of PCE; (2) for activity, we use the log of monthly GDP, estimated through our nowcasting methodology; (3) for asset purchase announcements, we use a narrative based on Fed communication; (4) for bond yields, we use the 10-year Treasury yield; and (5) for equities, we use the S&P 500 Index.
The model is estimated over the sample from January 2009 to June 2021.
Structural identification is achieved by means of a combination of sign and short-term zero restrictions in the spirit of Arias et al. (2019). In particular, as in Wheale and Wieladek (2016), we identify four structural shocks:
- A positive demand shock pushes up inflation and GDP and boosts equities and yields. As demand shocks are unobservable in real time, we assume asset purchase announcements do not react in the same period.
- A negative supply shock pushes up inflation but reduces GDP. The effects on yields and equities are not restricted. As with demand shocks, we assume asset purchase announcements do not react in the same period.
- An asset purchase shock is assumed to raise equity prices and asset purchases.
- In contrast, an adverse uncertainty shock lowers equity prices and is assumed to lead to more asset purchases.
Björn van Roye is a Senior Global Economist for Bloomberg Economics in Frankfurt. He previously worked as a Team Lead Economist at the European Central Bank and a Research economist at the Kiel Institute for the World Economy. He is author of several macroeconomic models and tools such the “ECB-Global model for spillover analysis” and the “BEAR toolbox” for estimating Bayesian VAR models.