Published 09/13/22
Source: Bloomberg by Gina Martin Adams and Gillian Wolff
Recent recession experiences have led most to believe that S&P 500 earnings are likely to get crushed in response to higher interest rates, but an examination of longer-term history shows earnings declines vary extensively. Without clear economic excesses to be resolved, the consensus for modest EPS growth seems more reasonable than is commonly believed.
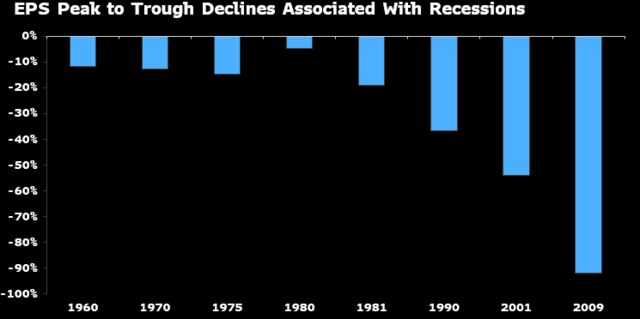
Not all recessions are equally troubling for S&P 500 EPS, and recent recessions may offer faulty guidance on what’s to come. The average peak-to-trough drawdown in EPS associated with recessions between 1960 and 1981 was around 12.6%, and the lightest was a mere 4.6%. In contrast, the average drop associated with the 1990, 2001 and 2009 recessions was 61%.
Unlike the prior three recessions, it is difficult to point to economic excesses likely to have severe earnings consequences. Though financial market bubbles developed with policy intervention, limited economic excess may shelter EPS from a severe decline. New home and auto sales have dropped 51% and 29% from respective peaks in 2020 and 2021, and GDP is off 0.5% this year, but EPS has yet to fall, and the consensus forecasts 6.9% growth in 2023.
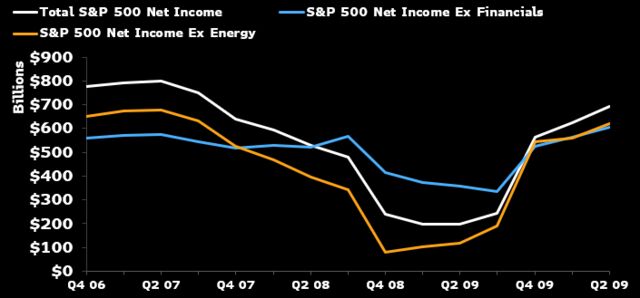
The Great Financial Crisis in 2008-09 brought about the sharpest EPS decline in over 50 years but offers little historical comparison to the current period. The financial sector contributed nearly half of the decline. Financials made up nearly 30% of overall S&P 500 earnings at their peak in mid-2007 and are currently 16% of earnings. Sector leverage, economic contribution from residential real estate, and the lending markets surrounding this segment are all vastly different today. Financial sector leverage (total debt/assets) is currently less than half of what it was in 2007, at 17% vs. 39%.
The oil boom in early 2008 helped prop up overall S&P 500 earnings during the financial sector collapse. Excluding energy sector earnings, S&P 500 net income fell 88% from peak to trough during the crisis.
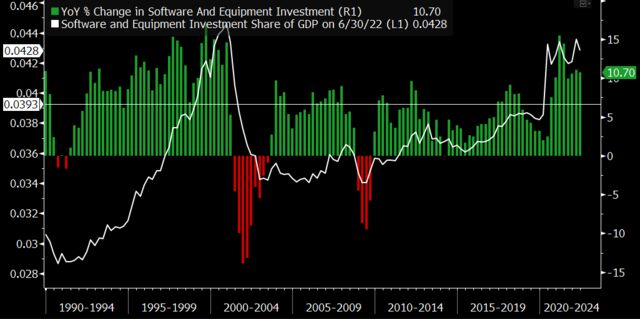
Market excesses in the TMT space offer hints that the earnings outlook may be more like 2001, but the economic backdrop doesn’t support the theory. The 2001 drop in S&P 500 EPS was extreme relative to all prior recessions, as capital-spending excesses related to the tech bubble and Y2K reversed course. From 2000 to 2002, S&P 500 TTM operating EPS dropped by more than half vs. the 1960-2000 average recession’s -13%. Excluding TMT, index EPS dropped 26%.
By 2000, equipment and software investment reached 4.5% of GDP after accelerating at an above-trend pace for six straight years. The capital spending boom resulted in S&P 500 capex/sales at 8.2%. Over the last year, equipment and software investment again topped 4% of GDP, but after below-average growth for 75% of quarters between 2013-20, capex was 5.8% of S&P 500 sales.
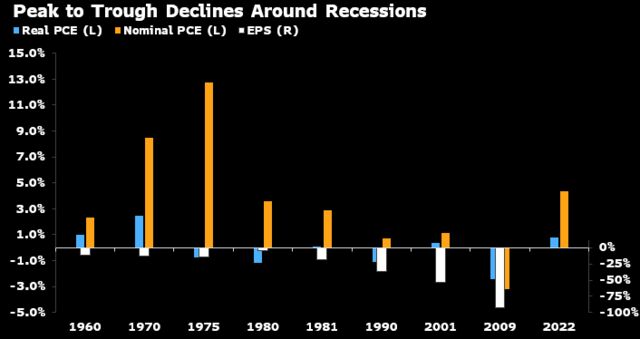
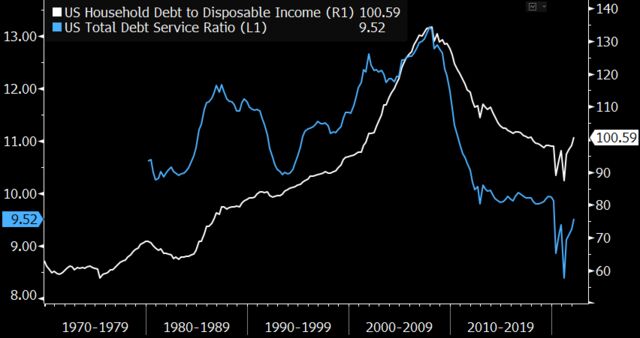
As US households became more indebted through the 30 years culminating in the Great Financial Crisis, EPS contractions around recessions grew, suggesting the household response to higher interest rates may be critical to determining the outlook for earnings growth. By 2007, household debt to income was at a new high, and the increase in interest rates resulted in highly abnormal contraction in both nominal and real consumer spending.
A repeat of the debt deflation spiral of 2008 seems extremely unlikely as household debt to income is back to levels last recorded around the turn of the century, and debt service is lower than at any point since the early 1980s. So far in the technical recession of 2022, consumption is holding in positive territory and may continue to do so in similar fashion to pre-financial crisis recessions.
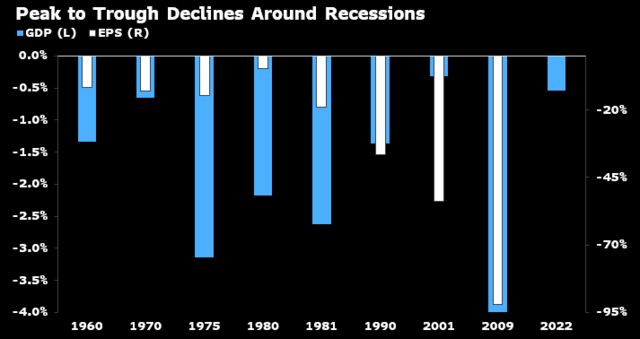
Earnings usually suffer during economic recessions, but the degree of decline varies significantly and depends only a little on the extent of GDP weakness. Major downturns in the economy in 1975, 1980 and 1981 coincided with relatively small impacts on earnings, while the large downdraft in growth in 2009 was mimicked by the worst decline in EPS since World War II.
Recency bias could be affecting market psychology on what to expect from EPS when the economy enters recession, after the 2001 and 2009 downturns resulted in vicious slides. Including these experiences, the average EPS decrease affiliated with recessions since 1960 is 31%; excluding them, it’s 17%.