- Bullish signs have emerged following near bear-market slump
- The risk-reward for short-term move is bullish: Cappelleri
(Bloomberg) —
From an easing in second-by-second selling momentum to a pop in junk-bond prices and fewer stocks hitting new lows, key data watched by analysts to gauge the real-time momentum of the stock market point toward an improvement.
While none of it proves the selloff is over, the indicators suggest the grip of bears is loosening. “The risk-reward for a short-term move is on the bullish side right now,” said Frank Cappelleri, a trading-desk strategist at Instinet.
Flurry of Buying
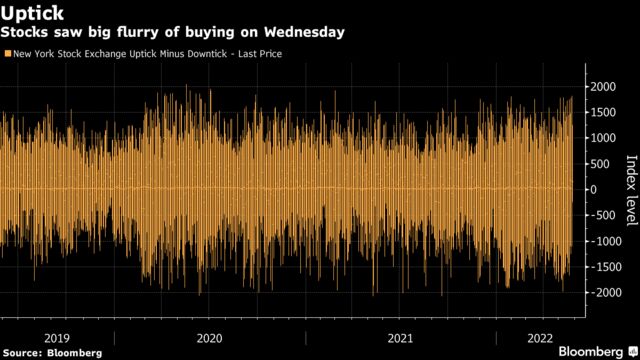
On Wednesday, a moment-by-moment measure of investor buying interest — the NYSE TICK index — registered its highest reading since March 2021, Cappelleri wrote in a note titled “10 Potentially Bullish Signs.” The gauge represents the number of securities trading on an uptick minus those trading on a downtick. An “exceptionally high” number indicates an intra-day buying surge, he said. Wednesday’s session also marked the second straight day with a TICK reading above 1,700, something that last happened in September 2020.
Pop in Junk
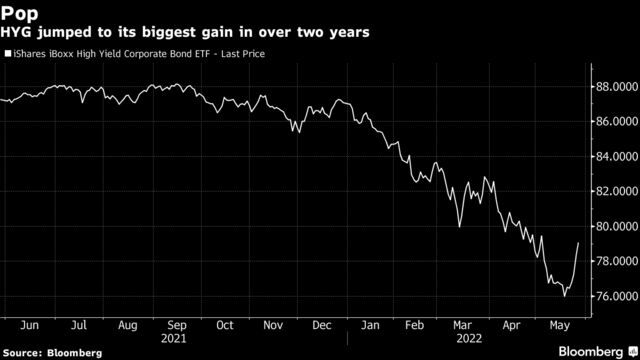
The iShares iBoxx High Yield Corporate Bond ETF (ticker HYG) jumped 1.5% to its biggest gain in over two years on Wednesday. The last time the fund — which tracks the investment results of an index composed of US dollar-denominated, high-yield corporate bonds — saw gains of that magnitude was mid-May 2020. While HYG is still clearly on a downtrend, seeing a higher low next will be crucial, according to Cappelleri. HYG rose as much as 1.1% on Thursday.
Fewer New Lows
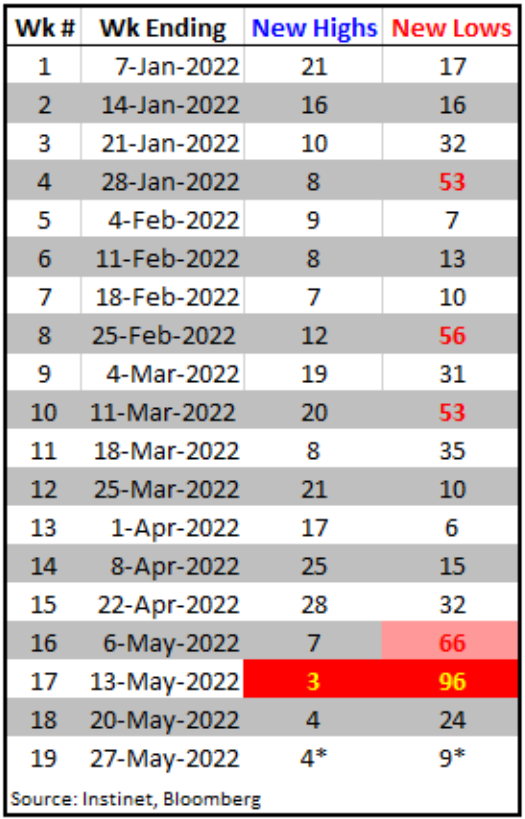
Cappelleri tracks about 180 exchange-traded bond and stock funds. Two weeks ago, around 100 of them notched new lows. Only nine have hit new bottoms so far this week.
Near Support Line
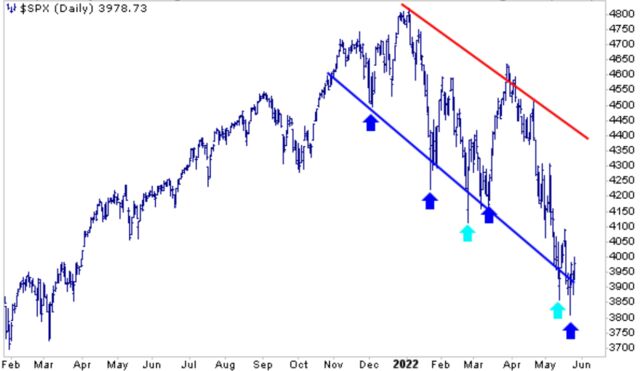
The best stock-market rallies have started near the lower threshold of the downward sloping trading channel, according to Cappelleri, and the benchmark S&P 500 index is near that line. In the graph below, the dark blue arrows show times when the biggest bouncebacks occurred recently. “We’re there again now,” the strategist said. “It shows that even with the market trending lower, there have been opportunities to rally.”