“Excellent article about the yield curve and how to interpret market participants expectations of the future”
Read This Before You Worry About the Yield Curve: Macro Man
Thursday, February 10, 2022 07:02 AM
(Bloomberg) —
Well, that’s put the cat amongst the pigeons, hasn’t it? At some point there will come a time when inflation data surprise to the downside, but that day was not Thursday, as U.S. CPI surged more than expected on remarkably broad-based price gains. This has naturally led to markets calibrating even more Fed tightening into the price over the next 12 months, and with it brought a further flattening of yield curves. Let’s take stock of what that actually means.
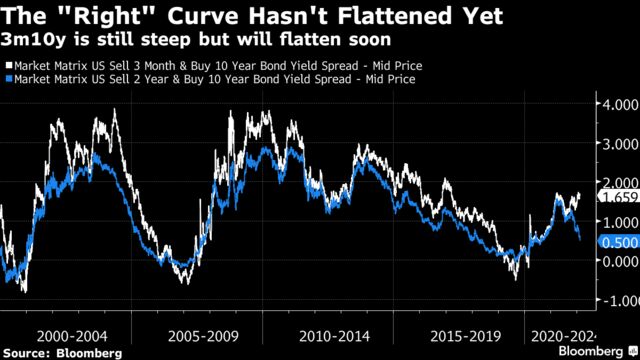
- With the onset of the Fed’s tightening cycle rapidly approaching, it’s time to talk about the yield curve. Many popular iterations of the curve (2s-10s, 5s-30s, and even 2s-5s) have flattened hard over the past few months, which has already prompted concern and nervous questioning of Jerome Powell at his last press conference. Is the Fed about to tip the economy into recession before it’s even started tightening? No, it isn’t. So let’s clarify a few things about what the yield curve says and what it ultimately means.
- The notion that an inverted yield curve tends to precede recessions has by now entered the popular consciousness. This insight derives from the tastefully-named Cam Harvey*, who first identified the phenomenon in the mid-1980s. The broader concern over curve-flattening is of a more recent vintage, however, as observers project recent trends into the future and worry about recession as the ultimate outcome.
- However, it is important to remember that the curve is a descriptive rather than prescriptive phenomenon. In Harvey’s own words, “the yield curve does not cause a recession in my framework. The yield curve is just an elegant way to summarize sentiment on the economy.” I would go further and say that the curve simply reflects the market’s best guess about where monetary policy is set relative to neutral.
- When policy is unambiguously easy, the curve tends to be steep. As monetary settings begin to tighten, there is a virtually Pavlovian response among fixed income operators to flatten the curve — it is simply what you do as policy inches closer to neutral. The curve inverts when the market believes that policy has become restrictive relative to its estimate of neutral.
- Viewing the curve through this prism makes it a little more understandable why recessions tend to follow inversions — that’s pretty much the outcome that you’d expect when policy becomes actively restrictive. That being said, the lead time between entering into a restrictive stance and economic contraction can be long and variable.
- We should note a couple of caveats at this juncture. The first is that the relevant short rate in the Harvey framework — and indeed in recession probability models — is three-month money, i.e. the current short-term interest rate. On that basis, the curve is still near its cyclically steepest point, though of course it should flatten hard over the next year. That’s the expectation embedded in 2s-10s, and the one-year forward 3m-10 curve is priced around 35 bps.
- It is also worth noting that the market’s estimate of neutral is not infallible. The scatter plot below shows the three-month yield on every day that the 3m-10y curve has been inverted since the mid-1960s. It is interesting to note not only the different neutral levels across policy cycles, but also within them. During high-inflation periods, the market has tended to revise up its estimate of the neutral rate — the three-month yield during inversions has risen within individual policy cycles. In low-inflation regimes, the market has revised down its neutral estimate, and the 3m yield has fallen during inversions.
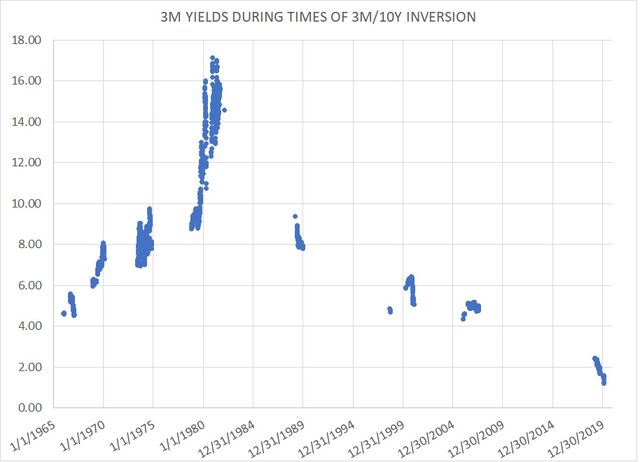
3 month yields during curve inversions
- The important takeaway here is that the market estimate of the neutral yield is NOT static, and indeed is subject to significant revision within a given policy cycle. There is also no guarantee that the market estimate is even correct. It’s true that the inversion that came during the last tightening cycle did indeed precede recession, but would it have in the absence of the pandemic? There’s a good case to be made that the answer is no.
- Of course, the Fed had also trimmed rates before the onset of the pandemic, so who knows what would have happened to the economy had they left them at end-2018 levels. The fact remains, however, that it took a once-in-several-generations event to keep the yield curve’s “winning” streak going.
- And this in turn raises a larger, more interesting issue. For most of the Fed’s history, its intended policy trajectory and especially its own view of neutral rates was broadly opaque. That has changed markedly over the past decade with the publication of the dot plot and its implicit statement of the Fed’s own view of the neutral rate (i.e., the long-run policy rate).
- Indeed, the whole rise of the r-star framework has led market participants to project either modeled estimates (say, that of the Richmond Fed) or their own guesses of r-star onto the 2% inflation target and come up with an estimate of the nominal neutral rate.
- I do wonder if some iteration of Goodhart’s Law will come into play — when a metric becomes a policy target, it ceases to have utility. In other words, if everyone focuses on their estimate of the neutral rate and focuses heavily on the yield curve, will that curve cease to have its traditional predictive powers?
- I would suggest to you that the dot plot and the popularization of the r-star framework has given the market an unusually high (and perhaps unfounded) conviction as to the level of the neutral or terminal rate. We can tease this out by looking at eurodollar yield curve slopes. The chart below shows the slope of the 4th versus the 12th eurodollar contract spread immediately before and during the last several rate-hiking cycles. A steep slope represents uncertainty over the level of the neutral rate beyond a reasonable (one year) forecast horizon.
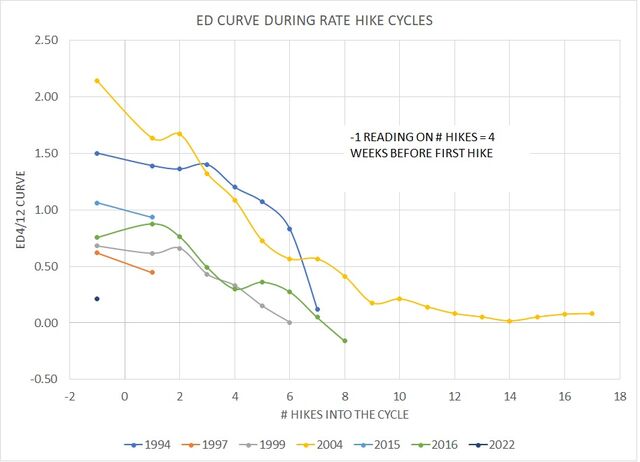
Eurodollar curve during Fed tightening cycles
- Unsurprisingly, that uncertainty tends to decrease as each policy cycle matures. What’s really remarkable this time around is that the market prices virtually no uncertainty at the start of this cycle; the March 2023/March 2025 spread (which will be the 4th/12th contracts at the time of the March Fed meeting) is currently trading at just 21.5 bps — that’s way, way below the levels prevailing before previous cycles.
- Now go back and take a look at that first scatter plot above, and how much three-month yields rose after initial curve inversions during high-inflation regimes. I’d suggest to you that there is a substantial risk that the market is underestimating the neutral nominal policy rate … and thus that curves will invert “early” without necessarily triggering a recession.
- Ultimately, it’s entirely possible that the Fed needs to get policy sufficiently restrictive that a recession results — the policy incentives provided by elevated inflation and the opacity of what actually constitutes neutral imply a substantial long-term risk of that outcome. But you’ll know that not by the inversion of the curve, but when it starts to re-steepen. I wonder how many people will be worrying about that…
* Yes, I know his full name is Campbell.