(Bloomberg Economics) —
A pronounced rise in U.S. bond yields is sending ripples across global markets. Bloomberg Economics’ model suggests the main driver is market expectations of a more robust U.S. recovery. Investors’ belief that the Federal Reserve will accommodate rather than lean against the rise is an important secondary factor.
A increase in yields driven primarily by expectations of stronger U.S. growth is a relatively benign scenario. It’s certainly a marked contrast with the 2013 taper tantrum, when our model shows it was fears of premature monetary tightening that moved the market.
- Since the start of the year, 10-year yields have risen about 50 basis points. Our model suggests that about half that rise is attributable to market expectations of stronger U.S. demand and about a third to expectations of tighter monetary policy.
- In the current context, expectations of tighter policy don’t mean a rate hike or tapering of asset purchases. As our U.S. team has said, the Fed is letting the markets do the heavy lifting — allowing a passive shift in the policy stance.
- The beginning of a climb higher for borrowing costs is a critical moment for the global economy and markets. Even with expectations of stronger U.S. growth as the main driver there are risks attached, especially as higher yields spill over around the world. The Reserve Bank of Australia has already responded with more bond buying.
Decomposing the Drivers of Rising Bond Yields
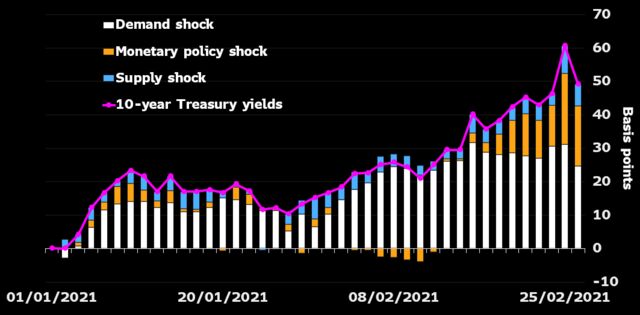
Source: Bloomberg Economics calculations
Notes: Cumulative contribution of the structural shocks to the change in 10-year Treasury yields from Jan. 1, 2021–Feb. 26, 2021.
The Model
Bloomberg Economics has used a sign restriction model to decompose the drivers of higher U.S. bond yields. In the spirit of Matheson and Stavrev, we exploit the co- and contrary movement of different asset prices at high frequency to determine what factors are driving the market:
- Demand shock: If bond yields, equity valuations and inflation expectations all rise, we attribute that to expectations of stronger demand pushing growth and inflation higher.
- Supply shock: If bond yields and inflation expectations rise, but equity valuations fall, we attribute that to a supply shock — like lower oil supply — pushing inflation higher but crimping growth.
- Monetary policy shock: If bond yields rise but equity valuations and inflation expectations fall, we attribute that to expectations of tighter monetary conditions.
Defining Demand, Supply and Monetary Policy Shocks
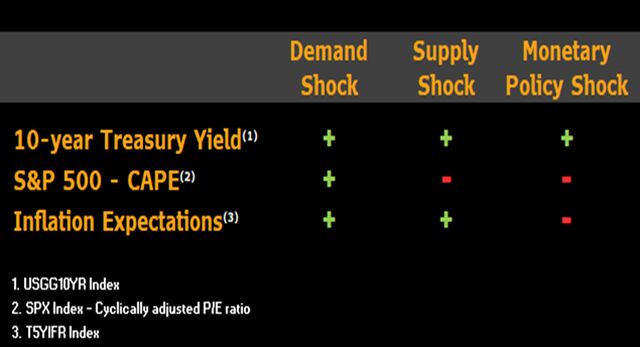
Source: Bloomberg Economics
In any given period, many different factors may be driving yields. What our model does is disentangle the relative importance of those factors. The table above shows the complete set of variables and sign restrictions we have in place. Further details are in the final section on methodology.
For all Bloomberg Economics analysis on the U.S. click here. For Bloomberg Intelligence rates strategy click here.
The Results
Since the start of the year, the yield on 10-year U.S. Treasuries has risen by about 50 basis points:
- Based on the model, 25 basis points of that increase is explained by expectations of rising U.S. demand — likely reflecting the combined impact of falling Covid cases and a rising probability the $1.9 trillion stimuluswill pass.
- Expectations of monetary tightening are the second most important factor, accounting for 18 basis points of the increase. In the current context, the way to interpret that is expectations that the Fed will allow the increase in yields, not lean against the market with additional stimulus.
- Expectations of a negative supply shock — less output and higher prices — account for seven basis points of the increase. A likely explanation is that markets view the increase in energy prices as playing a supporting role in the drama.
Interpreting the Results
The onset of a climb higher in borrowing costs is a stressful moment for the global economy and markets. Governments, corporates and households face higher costs. Markets are on edge. A look at the drivers and extent of the 2021 move provides some reason for comfort:
- An increase in yields driven mainly by expectations of a more robust recovery in the U.S. economy appears relatively benign. Certainly, higher yields driven by an inflationary supply shock or premature Fed tightening would be substantially worse.
Drivers of 2021 Yield Move vs. 2013 Taper Tantrum
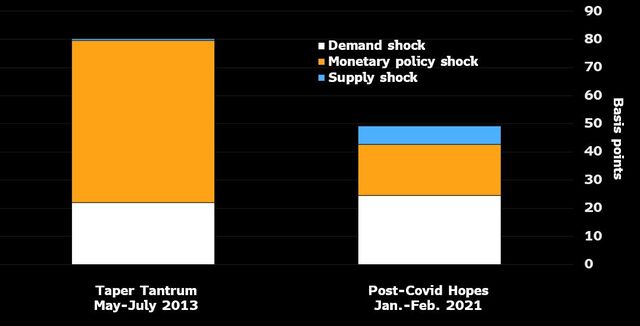
Source: Bloomberg Economics calculations
- The contrast with the 2013 taper tantrum is clear. From May to July 2013, Treasury yields rose 80 basis points, and our model shows that the main driver was expectations of monetary tightening, with hopes for stronger U.S. growth playing a secondary role. In 2021, the increase in yields is smaller, and the main driver is expectations of stronger growth.
Global Implications
Benign or otherwise, the increase in yields has already prompted reaction from central banks around the world. The Reserve Bank of Australiahas increased its bond purchases. The European Central Bank has signaled increased flexibility. The Bank of Japan is on guard against risks to its yield curve control policy. And in the U.K., fear of rising borrowing costs will shape Chancellor Rishi Sunak’s borrowing plans.
Looking forward, a critical moment will come when the U.S. Senate either passes or rejects the $1.9 stimulus bill. We’ll be keeping close watch.
Methodology
We use a small structural VAR which aims to decompose the drivers of U.S. asset prices into a set of structural economic shocks. We include three financial asset prices: the 10-year U.S. Treasury yields (USGG10YR Index), the logarithm of the S&P 500 – CAPE (SPX Index – cyclically adjusted P/E ratio) as well as five-year U.S. inflation expectations (T5YIFR Index).
The model is estimated at daily frequency from Jan. 1, 2003 to Feb. 26, 2021 with one lag, leaving us a sample size of 4,737 observations. We estimate the model with Bayesian techniques. We choose a non-informative Minnesota prior for the model’s coefficients. The variance-covariance matrix is estimated with maximum likelihood.
Structural identification is achieved by imposing sign restrictions and follows the methodology of Rubio-Ramirez et al. (2010). The baseline model we choose is that which minimizes the squared distance to the median contemporaneous impulse response for equity prices, bond yields and inflation expectations (Fry and Pagan 2011). All estimations are done with a new version of the BEAR toolbox.
The historical decomposition shows the cumulative contribution of each structural shock with respect to a specific date.
For the taper tantrum period, we begin with May 22, 2013, the day of Fed Chair Ben Bernanke’s testimony to Congress (see also Matheson and Stavrev (2014)).
For the current period, we choose the start of the year, when long-term Treasury yields started to increase.
The results are sensitive to the choice and the number of variables and shocks included in the model.