Cameron Crise
BloombergJanuary 24, 2023
You can almost see investors getting sucked into a vortex of bullishness and FOMO as stock prices around the world continue to rise. OK, there is the odd corrective day every now and again, but the rapid rally combined with some more favorable economic data in the likes of Europe have brewed a potent investment cocktail.
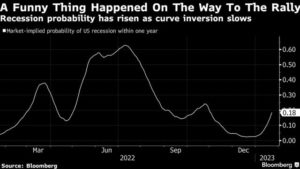
The reversal of last year’s negativity has been powerful, though in truth this sort of abrupt shift in sentiment (or at least price action) has become increasingly common in recent years. Whether it acts as a springboard for a new bull phase is far from certain at this juncture. Ironically, even as equity markets have surged higher, the implied probability of recession in the US has also risen notably this year.
- A few months ago it seemed like a foregone conclusion that Europe would spiral into recession, but these days it doesn’t appear quite so likely. The quiescence of energy prices has been an important driver of this shift, and we’re now at the point where the composite PMI in the euro zone has poked its head above 50 for the first time since June. Given the yawning gap between last year’s expectations and the apparent current reality, it seems pretty reasonable that European equities have fared so well of late.
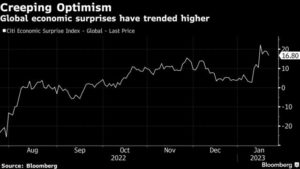
- One can obviously make the same argument about Chinese and Asian stocks thanks to the re-opening story. Indeed, with the Citi Global Economic Surprise Index rising steadily over the last six months, it’s easy to see why optimism has crept in among global investors … and it’s easy to wonder whether fear might be rising about missing out on the start of a new and powerful bull market phase.

- While US equities have lagged, the performance has still been pretty impressive. I don’t know about you, but my default setting for a market chart on the Bloomberg Terminal displays a six-month time window. It’s pretty notable that even the S&P 500 chart now shows an appreciation over that time frame — can you really call it a bear market if stocks have rallied over the past six months? That’s a tough call — after the dot-com bubble popped, for example, the six-month change in the SPX did go positive in November 2000 and March 2002, but it unsurprisingly spent the vast majority of its time in negative territory.
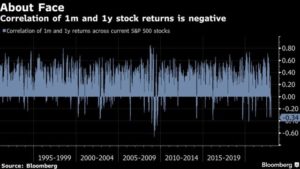
- What’s not in doubt is the vigor of the reversal. The correlation of one-month returns of current S&P 500 stocks to one-year returns is -0.34. That’s not the most-negative it has ever been — over the last few decades, the GFC bottom takes the cake there — but it is still among the sharpest turns that we have ever seen.

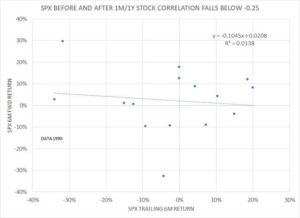
- There are a few interesting features of this behavior. Contrary to what I thought beforehand, these sorts of sharp reversals do not typically happen at market bottoms — they are pretty evenly distributed between trailing six-month gains and losses. I tabulated all observations since 1990 when the 1m/1y single-stock return correlation first fell below -0.25. The median 6-month trailing return in these circumstances is -0.2%.
| 4/4/2000 | 14.9% |
| 1/19/2001 | -9.3% |
| 11/6/2002 | -15.2% |
| 6/7/2006 | -0.1% |
| 2/1/2008 | -2.6% |
| 8/12/2008 | -4.4% |
| 12/18/2008 | -34.1% |
| 3/23/2009 | -31.8% |
| 8/4/2009 | 19.9% |
| 4/4/2014 | 10.3% |
| 3/7/2016 | 4.2% |
| 9/12/2019 | 7.2% |
| 6/4/2020 | -0.2% |
| 3/29/2021 | 18.5% |
| 7/20/2022 | -12.6% |
| 12/1/2022 | -2.4% |
| 1/17/2023 | 1.4% |
- It is also notable how much more frequent these reversals have been in recent years. This might be an artifact of my calculation method, where I simply assigned zero return for stocks with no price data. Still, it is notable that we have had three of these reversals in the last six months after having 14 in the prior 31 years. I wonder if that says something about the increased participation and leverage of micro-dated options in fueling the price action. Anyhow, what’s also interesting is that these sharp reversals suggest essentially zero correlation between price action over the past six months and that over the next six months.

- One thing I do find interesting about the table above is the presence of January 2001 on the list. That was another period when the US market started the year strongly after losses the previous year, though in that case it was spurred by actual Fed rate cuts at the beginning of January. Obviously, the bounce wasn’t as enduring as we have seen over the past few months, but the precedent nevertheless offers a bit of caution about getting sucked too far into early-year FOMO when economic headwinds persist.
- This is all the more the case because, somewhat bemusingly, my model of market-implied recession probabilities has risen notably thus far in 2023. “How in the world is that possible?” I hear you ask. In truth, I had the same question.

- While the model is not a black box — I have all the inputs in separate cells of an excel spreadsheet, so they are easy to test — the mathematics of cramming a bunch of different inputs into a cumulative probability distribution can get a little tricky. In this case, the primary driver appears to be a deceleration in the pace of curve flattening/inversion. In other words, a curve this inverted starts looking a lot more dangerous once that flattening starts to run out of puff. That seems to be the case for now.
- The street has been conditioned to expect equities to rally for most of the last four decades, so it is little surprise that investors have reverted to type with alacrity as the price action has become more constructive. Legitimately positive developments in Europe and Asia have helped spur the reversal.
- But as we have seen above, this sort of price action has become increasingly frequent, and ultimately doesn’t tell us a whole lot about what the next couple of quarters will hold. And despite those PMIs, the economic cycle still offers some downside risks to what’s priced into the equity market.
- NOTE: Cameron Crise is a macro strategist who writes for Bloomberg. The observations he makes are his own and not intended as investment advice. For more markets commentary, see the Markets Live blog.
