(Bloomberg Intelligence) — The overlap in S&P 500 stocks categorized both among the cheapest 20% and with the best momentum extends to 30, one of the highest in over a decade, and we believe such overlap could occur more often for these unusual bedfellows. Value and momentum tend to negatively correlate, but both had positive May returns driven by their higher-than-average overlap, including first-quintile crossovers Goldman Sachs, HP and Walgreens.
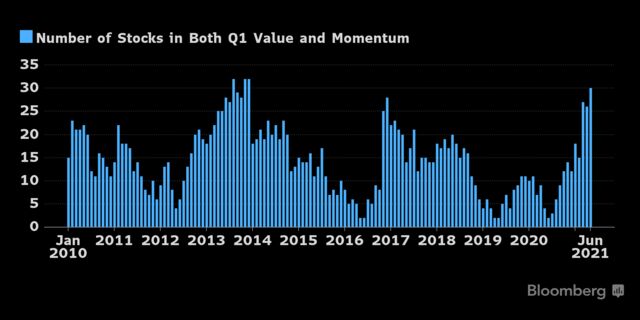
The overlap between strong-momentum and high-value S&P 500 equities keeps expanding, with this month’s portfolio rebalance landing 30 stocks in the top 20% of both factors. That total is eclipsed only by late 2013, when 32 benchmark members landed in the first quintile (Q1) of momentum and value, underscoring the value rotation in the U.S. market. It’s more than double the 14-stock average since 2010.
Click on our exhibit to access a spreadsheet listing all 30 stocks with strong momentum and high value (low price vs. Ebitda and sales). Our momentum factor is the average of six- and 12-month total returns, skipping the two most recent weeks.
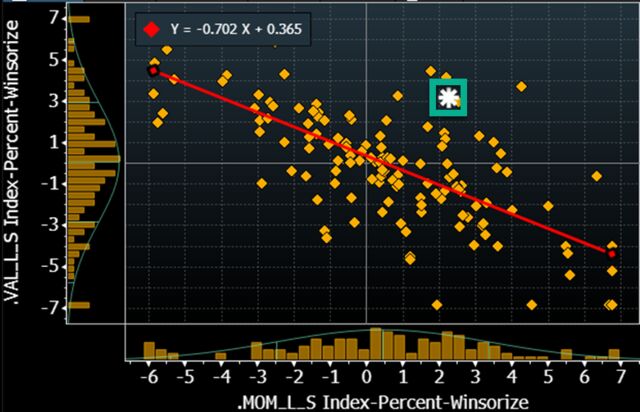
Returns were positive in May for BI’s value and momentum factors — unusual considering their historically negative correlation. The positive returns for both may signal a big shift, with the overlap between the two near its highest in 10 years. BI’s long/short momentum factor returned 2.26% in May compared with 3.18% for value. Observing a scatter plot of monthly returns over the past 11 years, along with a linear regression estimate, shows the unusual nature. Given a monthly momentum return of 2.26%, the simple linear model predicts a value return of minus 1.22%.
We’d expect a continuation of this positive relationship in the coming months, as long as the high overlap between the two factors remains.
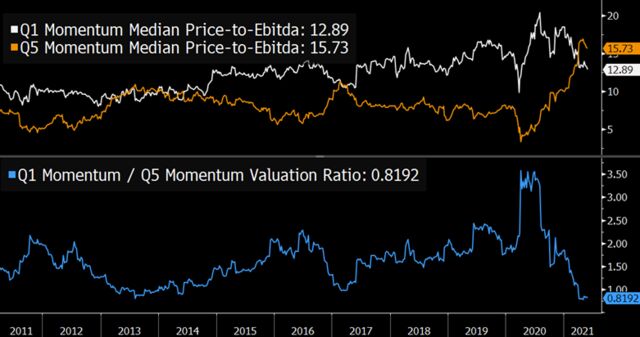
Similar to valuations of the low-volatility factor, the momentum factor is also historically cheap, aided by the sudden influx of inexpensive value shares entering the high-momentum cohort. Q1 momentum, the 20% of Russell 1000 stocks with the strongest average six- and 12-month returns (skipping the most recent two weeks), has a median price-to-Ebitda ratio of 12.89. The median valuation for the high momentum group (Q1) is actually lower than the low-momentum Q5 cohort, a historically rare occurrence, as low-momentum equities are at a median price-to-Ebitda ratio of 15.73x.
The ratio of Q1 valuations to Q5 valuations is 0.82, a first-percentile result over the past five years, indicating the current cheap rating of high- vs. low-momentum equities.
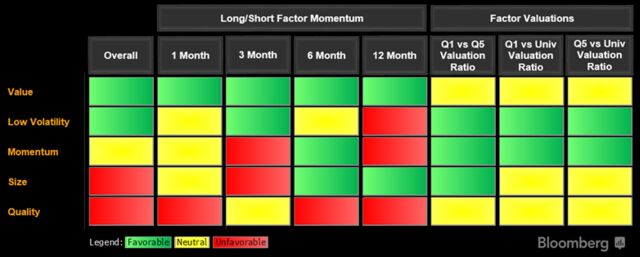
For the third straight quarter, value leads our factor scorecard, which uses performance and valuations to inform portfolio strategy around five main U.S. equity groups. Our value factor retains positive momentum in all lookbacks, though valuations are no longer a tailwind as the rally has worked off the factor’s recent valuation-ratio extreme. The low-volatility factor moves up in the ranks, helped by turning momentum and historically cheap valuations. The momentum factor is similarly helped by inexpensive valuations, though recent performance has been choppy.
The small-size factor falls in this update, as its rally has fizzled. Finally, quality brings up the rear, with mostly negative recent performance and valuations that aren’t very compelling.
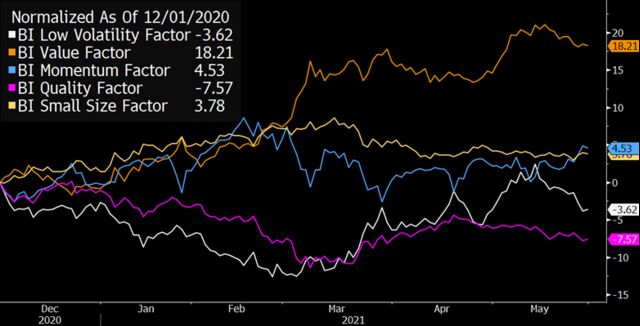
The long/short value factor again shows the strongest performance of our five main factor groups, appreciating 18.21% over the past six months. The U.S. value rally stalled from late March-early May, only to reassert itself over the past month. The small-size factor, recently a performance leader, flattened out over the past quarter, trading roughly flat since late February. It’s been a choppy path for the momentum factor, going largely nowhere over the past six months.
After a truly horrendous trailing year, BI’s low volatility factor has come back to life over the past three months, appreciating 10.06%. The quality factor continues its year-long struggles, depreciating 7.57% over the past six months.
Contributing Analysts Wendy Soong (Strategy)
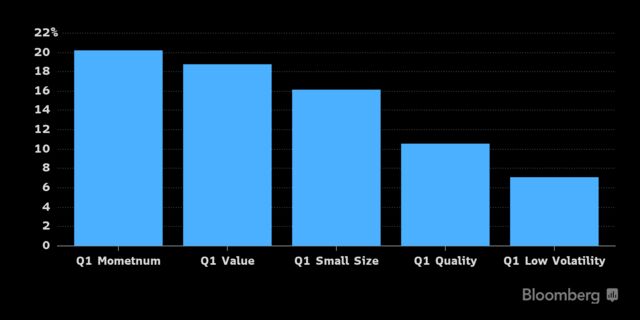
Though this earnings season was broadly strong, analyzing median EPS surprises for Q1 portfolios in each of our five main U.S. equity factor groups reveals dispersion in earnings results. Momentum had the strongest median results, beating expectations by a healthy 20.22%. High value stocks also reported strong earnings, exceeding estimates by a median 18.8%, while the small-size cohort outperformed by a median 16.17%. The high-quality (with a 10.54% beat) and low-volatility (7.07%) groups had more modest EPS beats this season.
Factor portfolios are calculated using the S&P 500 universe with no sector constraints. Factor values are as of May 26.